My test tenancy for OCI is a bit of a mess and I needed to give it a tidy-up to remove resources that I no longer used – rather than go through every resource individually and delete it, I found a way to automate this using the superb OCI-SuperDelete script.
I needed to delete all of the resources within a specific OCI Compartment. This can all be achieved using a single command with the script!
The easiest way to run this is using OCI Cloud Shell, using the following commands, which do the following:
Downloads the OCI-SuperDelete scripts from GitHub
Runs the delete script for a specific OCI Compartment – you need to specify the OCID of the compartment
In my lab environment I recently went through the process of configuring identity federation between OCI IAM and Okta using the guidance within the following documentation – SSO With OCI and Okta.
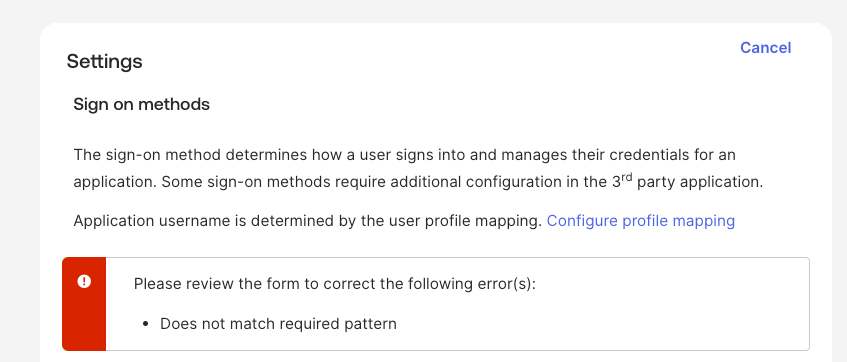
I ran into an issue within Step 4 – Configure Oktawhen trying to save the configuration in Okta it returned the following error:
“Does not match required pattern”
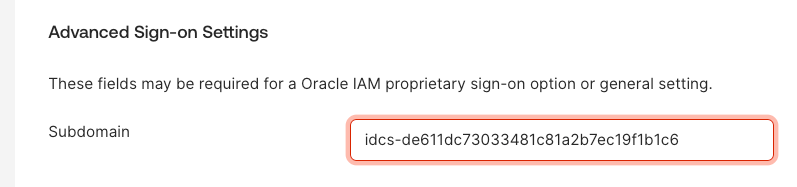
Helpfully it highlighted the setting that required attention (Subdomain):
After much trial and error it turns out that this needed the subdomain only, in this case “idcs-de611dc73033481c81a2b7ec19f1b1c6” rather than the entire URL that had been obtained https://idcs-de611dc73033481c81a2b7ec19f1b1c6.identity.oraclecloud.com:443. The instructions for this are a little misleading, as they suggest it’s the entire URL.
Once I’d entered the subdomain in the correct format, I could save the settings and move on the the final step…..testing ✅.
A customer asked me if there was a quick way to check the backup configuration for all of the VM instances within their OCI tenancy because they needed to ensure that all Boot Volumes had a Backup Policy applied ✅.
I created a PowerShell script for them (they are primarily a Windows shop) that does just that for them!
This script does the following
Loops through each Compartment within the tenancy and identifies the Boot Volumes within the compartment.
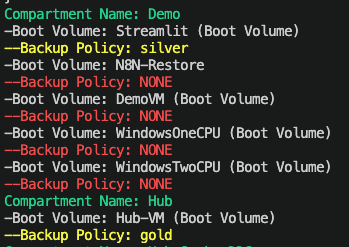
For each Boot Volume it identifies, checks if there is a Backup Policy assigned, if there is a policy assigned outputs the name of the policy otherwise report NONE
Here is the output of the script from my test tenancy, you can clearly see that I’m being naughty here and only have backup policies assigned for 2 of my 6 VM instances ⛔️.
Here is the script in all its glory! Before running it, update CompartmentId with the OCID of the root compartment within the tenancy.
This short video demonstrates how to use the OCI Console to backup and restore a Windows VM instance, which is useful for recovering deleted/corrupted files or if a VM instance needs to be recovered to a specific point in time.
This short video demonstrates how to use the OCI Events service to send an e-mail notification when the state of a resource changes, in this particular example I setup an event to send an e-mail when a Boot Volume backup has been deleted.
In this short video, learn how to use the OCI Monitoring Service to generate alerts when the CPU utilisation of a VM instance within OCI exceeds a given value – for example 50%.
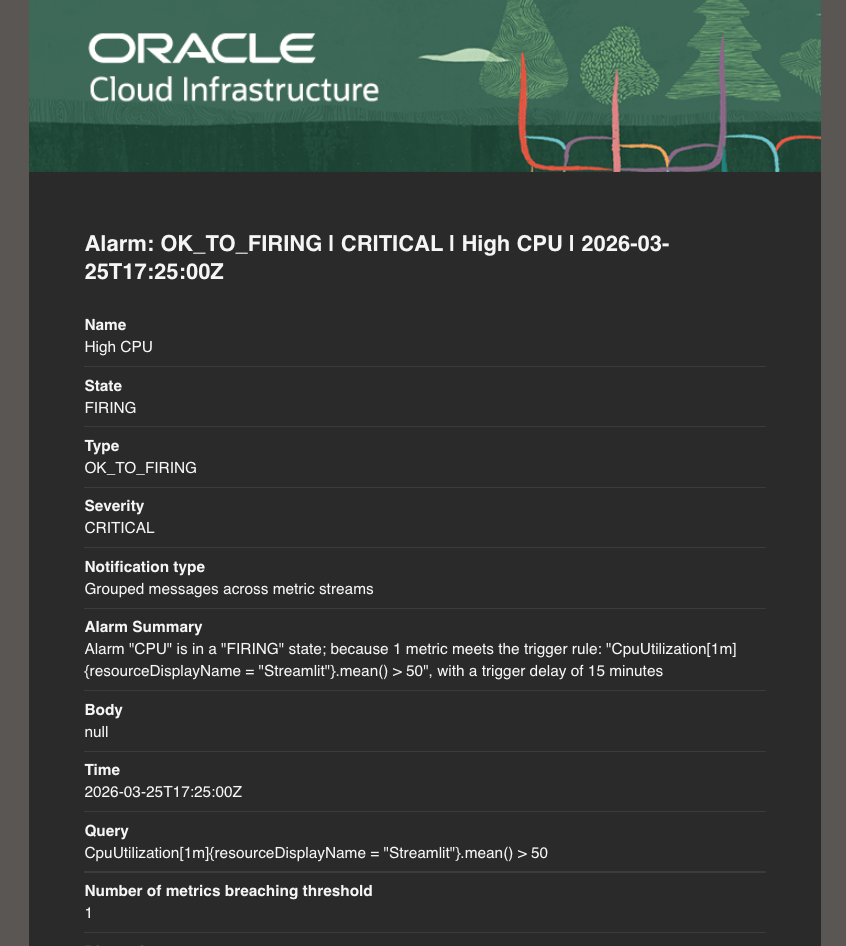
I needed to test an OCI Alarm I had created that should send an e-mail notification when the average CPU utilisation of a server exceeds 50% over a 15-minute period.
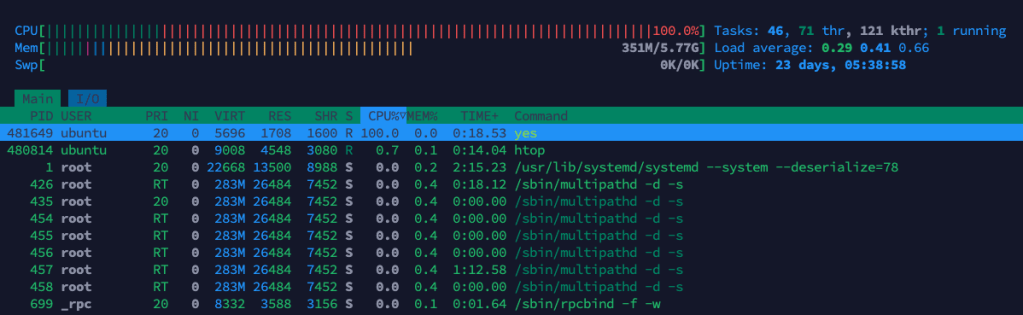
I found a “quick and dirty” way to generate CPU load on Linux using this one simple command:
yes > /dev/null &
This command runs yes (which outputs an endless stream of “y” lines) and redirects all its output to /dev/null (discarding it), with & putting it in the background.
I then ran htop on the instance and I could see that this pegged the CPU at 100%!
After 15 minutes, I received a lovely alert in my inbox:
If you do this, don’t forget to kill the process afterwards using “killall yes”.
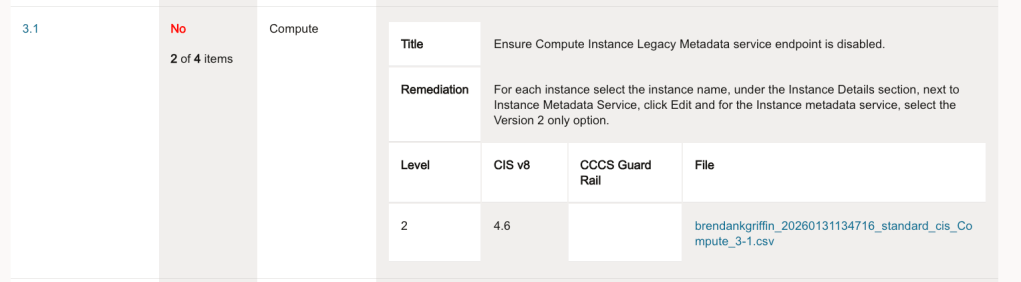
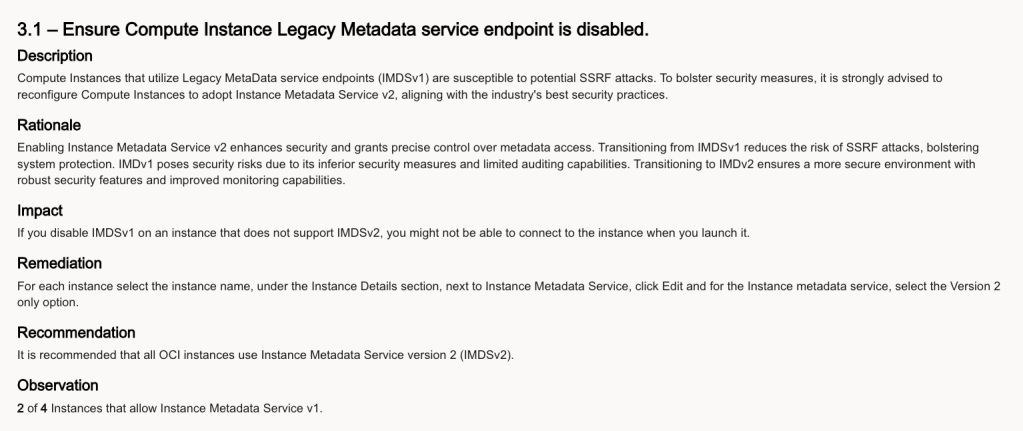
A customer of mine recently ran the OCI Security Health Check 👨⚕️, this flagged up the following issue:
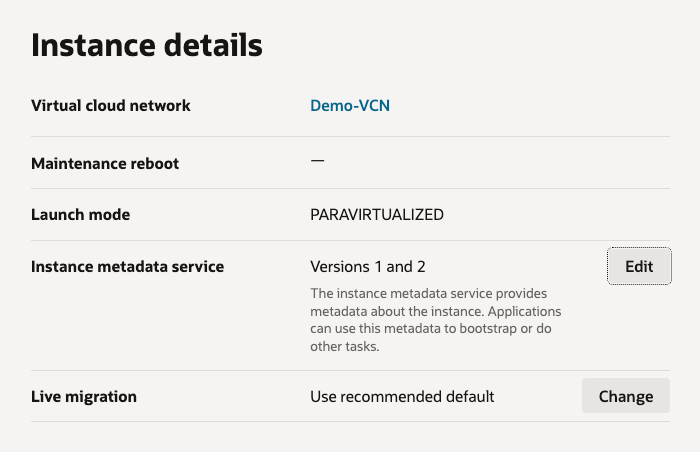
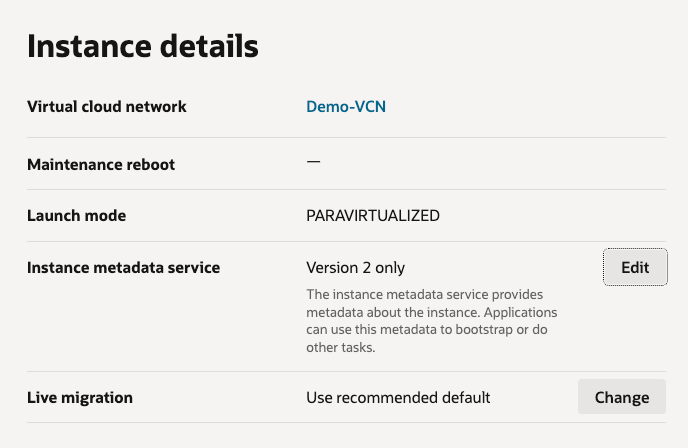
Rather than manually clicking through the OCI Console and updating this setting for all Compute Instances (which would have been mind-numbing!) to resolve this, I wrote a PowerShell script that loops through all instances within a tenancy and changes the Instance metadata service so that it only supports Version 2 (rather than V1 and V2), updating the configuration from this:
To this:
Here is the script in all of it’s glory, it can also be found on GitHub. Simply replace TenancyOCID with the OCID of the root compartment in the tenancy and run – this will loop through all compartments, find all Compute Instances and update the setting.
I’ve just posted a short video on YouTube that demonstrates how to use Cloud-init to automate the configuration of a VM instance in OCI during the creation process.
This is a great way to save time, drive consistency and reduce errors when configuring VM instances.
I’ve been working with a customer to setup an OCI Site-to-Site VPN between their On-Premises environment and OCI tenancy.
One thing we wanted to do was test the actual speed of the VPN to ensure that it was sufficient for the customers needs. I found the easiest way to do this was using the splendid tool iperf3 🏎️.
I had a play with this in my home lab, where I have an OCI Site-to-Site VPN configured between a Dream Router 7 and my test OCI tenancy – this provides private access to a number of VM instances that I have hosted within my OCI tenancy.
To get started I needed to install iperf3 on a server within my tenancy (this will be the endpoint for the speed test). To install iperf3 on Ubuntu, the following command can be used:
sudo apt install iperf3
To install on Oracle Linux run the following command:
sudo yum install iperf3
Once iperf3 had been installed on the server within OCI, I then needed to install it on my client machine that sits On-Premises (my house!), iperf3 supports Windows and macOS. I installed on my mac using the instructions found here – https://iperf.fr/iperf-download.php.
Now that I have iperf3 installed on the client and server, the next thing I needed to do was open the ports used by the iperf3 (TCP 5201 by default) on both the Linux server itself and the Security List/NSG within OCI 🔐.
Here are instructions for opening a local port on Ubuntu. To open the port on Oracle Linux, use these commands:
sudo firewall-cmd --add-port=5201/tcp
sudo firewall-cmd --runtime-to-permanent
Use these instructions to open a port in a Security List. To open a port in an NSG use these instructions.
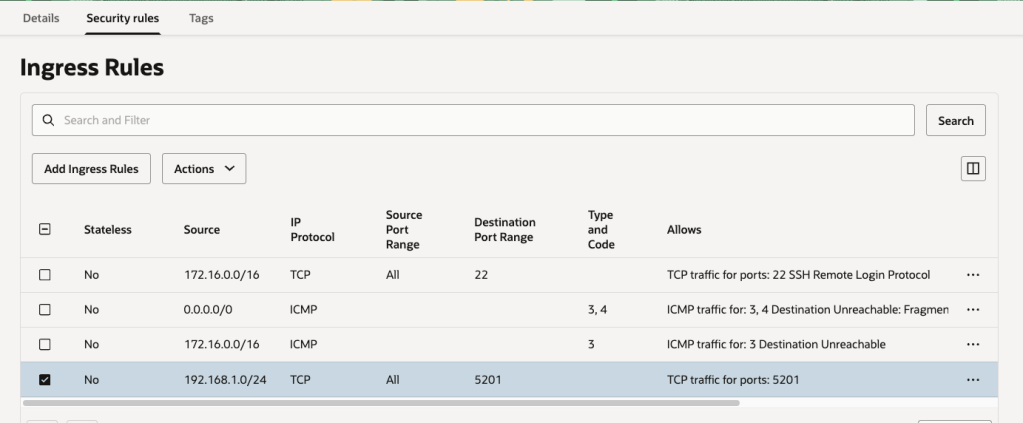
In my case I’m only using Security Lists to secure access so have the configuration below, which permits traffic on TCP port 5201 from my home network (192.168.1.0) to the subnet containing my VM instance within OCI (172.16.1.0/24):
Now that the ports have been opened on the Linux server AND either the Security List or NSG (depending on what you use).
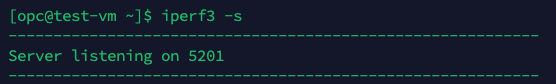
The next thing to do is to start iperf3 on the Linux server in listening mode, to do this I ran the following command.
iperf3 -s
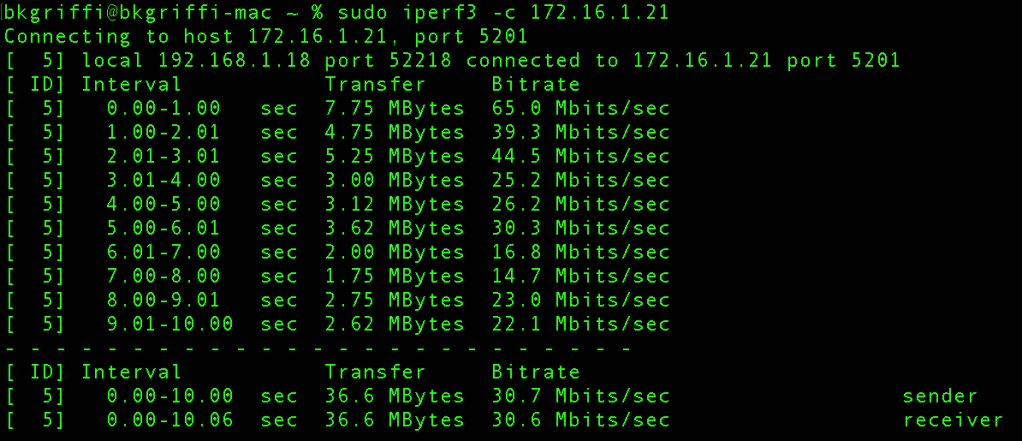
I can now start the test from the client machine (macOS in my case) by running the following command, which connects to the IP address of my Linux VM instance – note, it’s using the private IP address so will route over the VPN tunnel:
sudo iperf3 -c172.16.1.21
It will then run some speed tests and output the results:
From this I can see the transfer speed in MBit/s and MBytes/s for each of the 10 intervals and also the average send/receive speed.
In the example above, I was seeing ~30 Mbits/sec throughput.
This was super-helpful for me, hopefully you find it useful too.
Whilst I used it to benchmark VPN speeds, it can be used in other scenarios too, to understand the network throughput between two devices on the same or different networks.