
I’ve been helping a customer troubleshoot network connectivity between their On-Premises environment and OCI, one tool that has been super-useful is tcpdump (which I’d never used before).
I wanted to put together a short and simple guide on how to use this amazing tool to capture network traffic to help troubleshoot connectivity issues.
First things, first – what is tcpdump?
tcpdump is a powerful command-line packet analyzer that captures and displays network traffic (TCP/IP and other protocols) flowing through a system, acting as a vital tool for network troubleshooting, security analysis, and diagnosing performance issues by letting users filter and inspect individual data packets in real-time or from saved files.
I’ve using this tool on Oracle Linux to troubleshoot connectivity between a Windows server hosted On-Premises and an Oracle Linux VM instance hosted in OCI (where else 😀).
To get started, the tool can be installed on Oracle Linux using the following command:
sudo dnf install tcpdump
Once tcpdump has been installed, the first thing to do is list the network interfaces on the server – so you can select the relevant one to take the capture from.
sudo tcpdump -D

I’m interested in the traffic on the main NIC so will use “enp0s6” to take the capture.
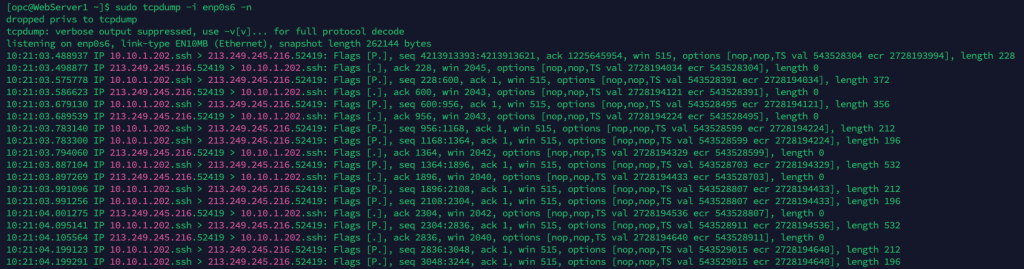
Running the following command captures all network traffic on this NIC, it also disables name resolution so you see the IP addresses rather than hostnames of the devices (which makes things a little easier to read).
10.10.1.202 is the IP address of the Oracle Linux VM instance.
sudo tcpdump -i enp0s6 -n
This is obviously quite chatty, to see traffic on a specific port we can run the following command, in this case it will only list traffic on port 80 (HTTP):
sudo tcpdump -n -i enp0s6 port 80

Again, this is quite chatty. I’m only interested in traffic on port 80 from a specific machine, so ran the following – update the port/host parameter as needed to specifiy a different port/IP address combo.
sudo tcpdump -n -i enp0s6 host 213.249.245.216 and port 80
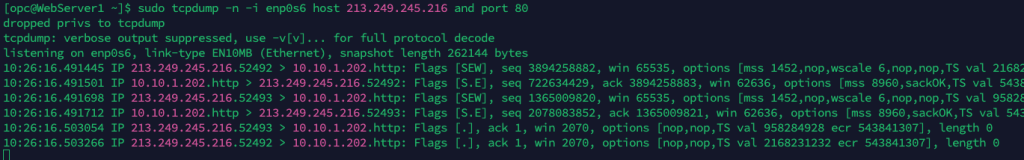
The trace now only shows port 80 traffic to/from the IP address 213.249.245.216.
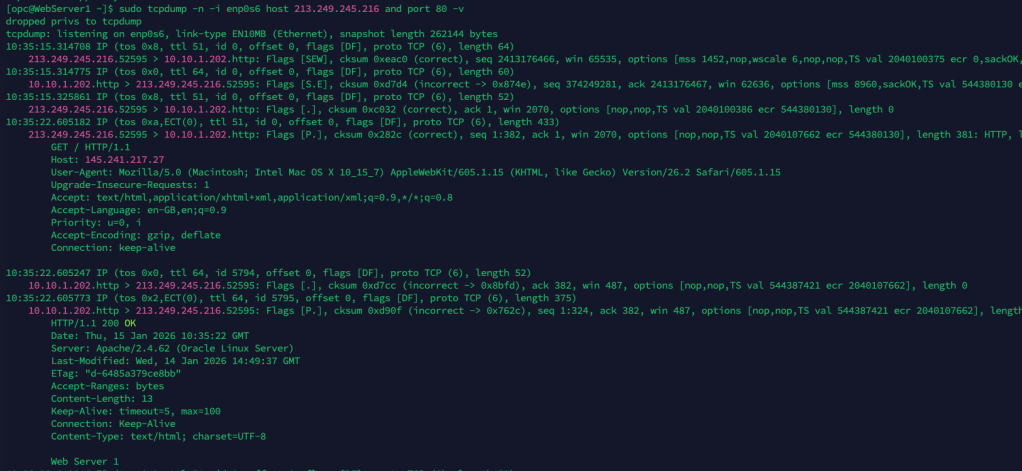
One other useful parameter is -v which provides more verbose output (example below), in this case it captures the actual HTTP request and response – how cool 😎.
sudo tcpdump -n -i enp0s6 host 213.249.245.216 and port 80 -v
Another useful tool for me to have in my toolbelt 🔨.

Leave a comment